As a marketer, you’re probably responsible for generating leads and then nurturing those leads so they turn into customers, resulting in revenue for your company. No pressure, right?
Also, as a marketer, you probably have to prove what you’re doing is working. With everything going digital, there is SO much data at our finger tips. But what does it actually mean?
Sometimes when reviewing data, you may think you’ve uncovered some big insight and your marketing has led to this dramatic shift….then after looking at it, you may start having a hard time figuring out what means what. Did this cause that? Is that correlated to this? Did that lead come from this? Did this result in that increase? Or did this campaign have a negative effect? Our Chief Digital Officer refers to this as paralysis by analysis.
Before you know it, you’re in this state of brain paralysis. Initially thinking you uncovered some great effect your marketing was having…now you don’t know up from down. You’re probably wondering how you ended up in this rabbit hole…or maybe even what your name is.
Here are our five tips to avoid paralysis by analysis:
- Create a custom dashboard inclusive of all your marketing efforts – bring it all together so you can get the whole picture. Read more on that here
- Keep a focus on your KPIs – know what your KPIs are and focus on those
- Customize your dashboard to focus on the different stages of the sales funnel – see more on this below
- Repeat after me: Correlation does NOT equal causation. Thanks Michael Aagard. Remember that just because something seems to correlate, that doesn’t always mean it truly does!
- Take a break from the analysis every once in a while – walk through the office, step outside and get some fresh air!
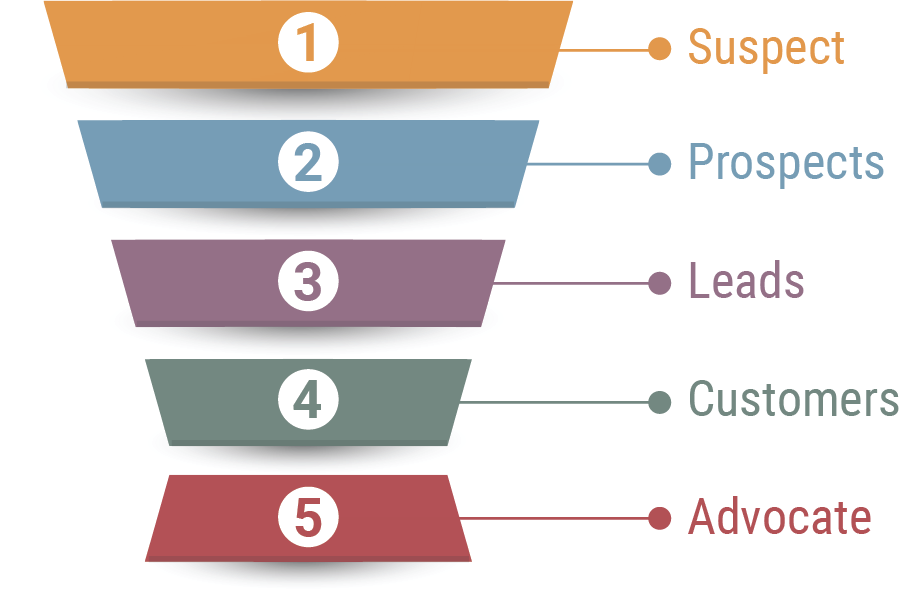
Let’s look at how you can customize your lead generation dashboard to speak to the different areas of the sales funnel.

- Suspects – There isn’t really anything you can track here, but you can use what you learn about your prospects, leads and customers to then better target and identify suspects.
- Prospects – Track your website sessions to see how many people are researching your business. Look at website sessions, referral sources and new vs repeat users primarily. Look at where people are visiting your website from, their demographics, what they are viewing on your website, how long they spend on your website, what they do on your website. Looks at clicks on ads. What keywords are driving those? What types of ads? What geography did it come from? What time do most clicks occur? What day of week?
- Leads – Track the number of people that are converting. What source or medium are those conversions coming from? What type of conversion was it? Phone call, website lead? Use attribution tracking to track conversions and assisted conversions by medium. Track the quality of leads to better score your leads.
- Customers – Track the number of leads that convert to customers. Track the value of those customers to determine your return on investment (ROI), your cost per acquisitions (CPA) and your customer lifetime value (CLTV).
- Advocates – Track what your customers are saying about you online. Reviews, social posts. Track the engagement of customers and repeat customers. Are customers opening your emails? Are they completing the objective of your emails? Are customers engaging with you on social media?
Once you have your dashboard set up in this “funnel-centric” way, now you just need to figure out what its telling you. You should be able to get some pretty powerful insights to utilize across your organization. Just remember our five tips to avoid analysis paralysis.
If you need help creating an effective lead generation dashboard, give us a shout. We would be happy to assess your current strategies and reporting methods and suggest improvements to take you to the next step and ultimately, dive more leads.


